Gene regulation and the lac operon
Gene regulation is the process by which cells, whose DNA content is constant (for the most part) over their lifetime, change their behavior. The gene content of a particular cell determines the functions that the cell can perform, the the functions that it actively perform is determined by which subset of these genes is expressed. Therefore, gene expression must be toggled according to the environment, so that a cell can function in variable environments. In this post will discuss (and write down a toy model for) one of the most famous examples of a gene regulation circuit: the lac operon, which governs the metabolism of lactose in E. coli. This circuit was understood in 1961 by Jacob and Monod. Before jumping into the mechanism, we will define some terms.
Transcription
Transcription is the process by which a DNA sequence becomes a piece of messenger RNA, which in turn is converted into a protein. It is worth noting that most RNA that is transcribed never becomes a protein: a large fraction of RNA has a structural function in the ribosome, which is the machine that makes proteins from messenger RNA. For example, in S. cerevisiae, 60% of the cell’s total transcription is devoted to transcription of ribosomal RNA. However for the purposes of the lac operon, we will be talking about transcription of so-called “coding genes” which do get transcribed. Transcription is carried out by the enzyme RNA polymerase, which travels down a strand of DNA, producing a single strand of RNA corresponding to one of the two DNA strands (which are complementary to one another). This mRNA later gets translated into a protein, which carried out some function for the cell.
Transcription factors and promoters
A transcription factor is a protein responsible for regulating the expression of genes, via binding to specific DNA sequences, which fall into two categories: enhancers and promoters. Promoters are sequences of DNA situated upstream of genes, and the transcription factors that bind to them are called general transcription factors. The binding of these transcription factors increases the recruitment of RNA polymerase and therefore the rate of transcription of the downstream gene. Enhancers are regions of the genome that have a similar effect, but can be located either upstream or downstream of the gene whose expression they regulate — they carry out regulation by virtue of their physical proximity to the gene of interest: since DNA is a long and curved molecule, regions need not be close along the length of the strand in order to be close in physical space. Transcription factors which bind to enhancers also increase transcription rates of genes by recruiting RNA polymerase. Trascription factors (TFs) constitute a sizeable fraction of all genes; in humans there are \(\sim 1500\) transcription factors out of \(\sim 20000\) genes. In both S. cerevisiae and E. coli there are a few hundred TFs out of roughly 5000 genes.
The lac operon
E. coli have the ability to consume multiple different types of sugar, but that doesn’t mean that they are agnostic to what they eat. If glucose is present, even if other sugars such as lactose are present, the bacteria will only consume the glucose. Once the glucose runs out, they will shift their metabolism and start consuming lactose. This shift is called a diauxic shift, and occurs as a result of changing gene expression in the cell in response to the environment. E. coli synthesizes an enzyme that breaks down lactose, but only in the joint presence of lactose and absence of glucose. How does it control this process?
The lac operon is a collection of three genes under the control of a single promoter. These genes code for proteins that enable the metabolism of lactose: one enzyme (lacZ) cleaves lactose into glucose and galactose, the other (lacY) transports lactose into the cytoplasm through the membrane, and third (lacA) codes for a protein whose function, amazingly, remains unknown. These three genes, put together, amount to around 5000 bases (5kb) of DNA. The E. coli cell needs to transcribe these genes at a higher rate when there is lactose but no glucose in the environment.
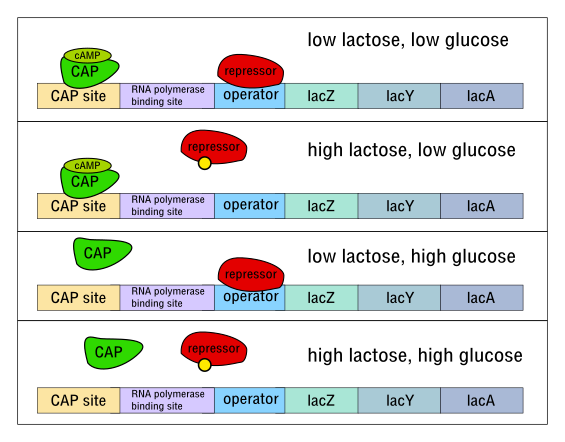
In order to accomplish this behavior, a system has evolved where the default state is repression. That is, in absence of any external stimulus, there is a repressor protein which binds near to the lac operon promoter (at a region called the operator) and prevents transcription of the associated genes. When there is lactose in the environment, it is metabolized at a low rate, and a product of this metabolism, allolactose, binds to the repressor, changing its shape and making it unable to block transcription. RNA polymerase can now transcribe the operon, increasing the lactose metabolism rate. Note that this order of events displays positive feedback: a little metabolism of lactose produces more allolactose which produces more lactose metabolism, etc.
However, in addition to being transcribed in the presence of lactose, the lac operon is repressed in the presence of glucose. This repression is controlled by a signaling molecule called cAMP, which varies inversely with glucose concentration in the cell—it essentially indicates hunger for glucose. When cAMP concentrations are high, the cAMP molecules form a complex with a molecule called CAP, and bind upstream of the promoter, encouraging transcription. Conversely when glucose is high there is little cAMP in the cell, and so transcription of the lac operon is reduced, because the cAMP-CAP complex does not get created and upregulate transcription.
A mathematical model
How can we make a simple mathematical model of this process? To begin with, we can try to understand the following observation: there is a sudden shift in levels of lac operon transcription as a function of lactose levels, as opposed to a continuous change. Once we understand this switch-like behavior, we can also try to understand when bistability occurs: namely, if the cell is mostly consuming glucose, and enough lactose is introduced, the cell undergoes a diauxic shift and remains in mostly-lactose-metabolism mode even when the original conditions are restored.
Let us denote the number of lacZ transcripts in the cell as \(Z\) — we will use this as a readout to see how much lactose-metabolizing enzyme the cell is producing. lacZ transcripts are produced by RNA polymerase binding to the promoter region upstream of the lac operon. However, this promoter region can exist in two forms: bound to the repressor and unbound from the repressor. Now the repressor in turn can exist either bound either to the promoter or bound to allolactose or free. This is the reason that increasing the concentration of allolactose increases the rate of transcription of \(Z\): it binds to the repressor and therefore stops the repressor from binding to the promoter region. Therefore we would like a dynamical equation for the concentration of allolactose, denoted \(A\), in addition to one for the concentration of lacZ. Our coupled equations then have the form
\[\dot Z = -\delta Z + f(A)\] \[\dot A = -\gamma A + g(Z)\]where \(f(A)\) is the rate of RNA polymerase binding to the unbound promoter, and \(g(Z)\) the rate of the lacZ enzyme binding to lactose, which produces allolactose. \(\delta\) and \(\gamma\) are decay rates of lacZ and allolactose respectively. What are the functional forms of \(f(A)\) and \(g(Z)\)? To answer this, we have to make a brief digression into enzyme kinetics.
Enzyme kinetics
Imagine that we have a certain concentration \(a\) of substrate, and concentration \(e\) of enzyme. They have a certain binding affinity which determines the rates at which they bind together. Let us denote the unbound substrate as \(A\), the unbound enzyme as \(E\), and the bound substrate-enzyme complex as \(EA\). The reaction equation for the binding process is then
\[E+A \underset{\beta}{\stackrel{\alpha}{\rightleftharpoons}} EA.\]In equilibrium, what is the concentration of the \(EA\) complex, assuming that we put in a concentration \(a\) of substrate and \(e\) of enzyme? The rate of change of \([EA]\) (where square brackets denote concentration) has a positive contribution from the forward reaction and negative contribution from the backward reaction:
\[\frac{d[EA]}{dt} = \alpha [E][A] - \beta [EA].\]Therefore in steady state, this time derivative vanishes and we have \([EA] = \frac{\alpha}{\beta}[E][A]\). There are, however three unknowns in steady state: \([E]\), \([A]\) and \([EA]\) — so we need another two equations to be able to solve for these. These two equations come from conservation of the total number of enzyme and substrate molecules separately, and give us \([E]+[EA]=e\) and \([A]+[EA]=a\). One can then solve these three equations, but the solution is a bit messy. We can simplify things if we assume that the enzyme is the limiting reagent—then \([A]\approx a\) since amount of the substrate that is bound in the complex is negligible. Then our equations become \([EA] = \frac{\alpha}{\beta}[E]a\) and \([E]+[EA]=e\), which have solution
\[[EA] = \frac{ea}{\beta/\alpha+a}.\]This equation, also known as the Michaelis Menten equation, will be our friend in trying to understand reaction rates when one of the reagents is limiting. Note the behavior of \([EA]\) on \(e\) and \(a\). It is linear in \(e\) because the enzyme is limiting, while it saturates as a function of \(a\), since all the enzyme becomes bound in the \([EA]\) complex so the effect of adding more substrate diminishes. Note that if the enzyme required \(n\) molecules of \(A\) in order to form a complex \([EA^n]\), then the concentration of this complex in equilibrium would be
\[[EA^n] = \frac{e a^n}{\beta/\alpha + n a^n}.\]The exponent \(n\) changes the shape of this curve as a function of \(a\), which can have important effects on gene regulation dynamics, as we will see shortly.
Back to the lac operon
Returning back to our model for the regulation of the lac operon, we can first posit a form for \(g(Z)\) for the rate of lacZ binding to lactose. If we assume the lactose is plentiful, then \(g(Z) = \frac{Zl}{l+K_1}\) where \(l\) is the concentration of lactose, and \(K_1\) is a ratio of reaction rate constants, analogous to \(\beta/alpha\) from the example above.
Now we want to guess a form for \(f(A)\), which is proportional to the rate of binding between RNA polymerase and the unrepressed promoter. Recall that promoter can only be repressed by repressor molecules that are unbound by allolactose. Assuming that allolactose is more plentiful than the receptors, the concentration of such unbound repressor molecules (using Michaelis Menten) is \(R = \frac{rK_2}{A+K_2}\) where \(r\) is the overall concentration of repressors. The concentration of unbound promoters is, by the same logic, \(P = p\frac{K_3}{K_3+R}\).
We can therefore approximate the concentration of unbound promoters as \(\frac{p(A+K_2)}{A+K_2+rK_2/K_3}\). The details of this expression are not important—more important is that, as a function of \(A\), it is a saturating function with a small \(y\)-intercept, for \(r\gg K_3\). The physical meaning of the small \(y\)-intercept is that when there is no allolactose, the repressors bind to most of the promoter regions. Note that we can roughly approximate \(f(A)\) as \(\frac{pA}{A+K}+r_0\), where \(r_0\) is this basal transcription rate, and the first term captures the dependence on allolactose concentration.
We now have a set of differential equations that describe the levels of lacZ and allolactose in the cell. Parameterizing unknown rates by \(\mu\) and \(\nu\), we have
\[\dot Z = -\delta Z + \mu \frac{pA}{A+K}+r_0\] \[\dot A = -\gamma A + \nu \frac{Zl}{l+K_1}\]Analysis
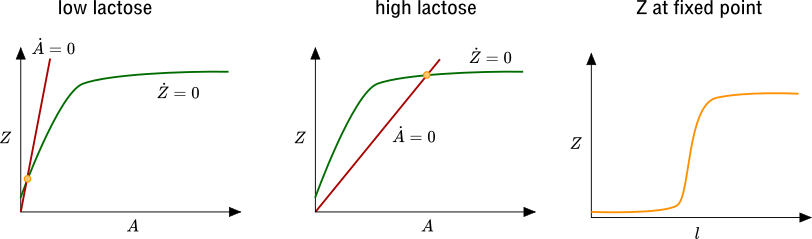
We can analyze the behavior of our differential equation model by looking at the nullclines of our system: the lines in the \(A\)-\(Z\) plane along which the \(\dot Z\) and \(\dot A\) vanish. Fixed points of the dynamics correspond to intersections of these nullclines, since both \(\dot Z\) and \(\dot A\) are zero at a fixed point. In the figure below we draw the nullclines. Note that increasing lactose concentration \(l\) causes the \(\dot A=0\) nullcline to tilt down. We can see that for small \(r_0\), the \(Z\) at the fixed point increases slowly as a function of \(l\). However, due to the shape of \(f(A)\), when the slope of the \(\dot A=0\) nullcline crosses through the slope of the \(\dot Z=0\) nullcline at \(A=0\), the \(Z\) at the fixed point (represented by the yellow circle) increases drastically. This is precisely the behavior that we sought to understand with our mathematical model: the level of lacZ increases sharply as a function of lactose, rather than gradually. This is a consequence of positive feedback.
Now, how does glucose come into the picture? Recall that glucose decreases the prevalence of the cAMP-CAP complex, which itself encourages transcription. To capture this effect we can add a term proportional to \(\frac{K}{K+g}\) to \(\dot A\), where \(g\) is glucose concentration. If the slope of the \(\dot A=0\) nullcline for large \(l\) and large \(g\) is still larger than the slope of the \(\dot Z=0\) nullcline at \(A=0\), then only by reducing \(g\) can we increase the \(A\)-intercept of the \(\dot A=0\) nullcline and acheive high levels of lacZ expression.
Bistability
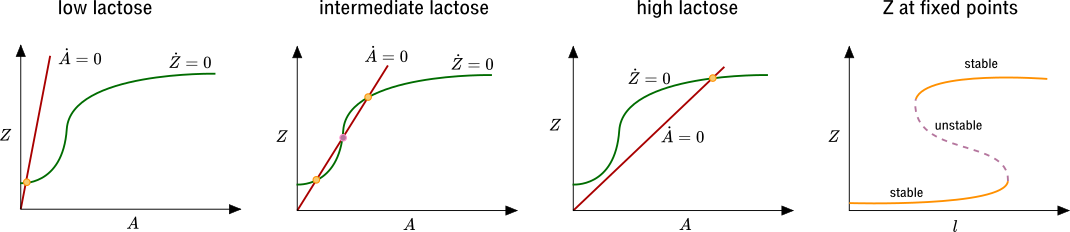
Using what we have learned, we can now ask what happens if multiple allolactose molecules are needed to bind to a repressor to stop it from repressing transcription. Then, as we discussed above, the shape of \(f(A)\) changes. Now, as we decrease the slope of the \(\dot A=0\) by increasing \(l\), there is a range of \(l\) for which there are three fixed points in the \(A\)-\(Z\) plane. One of them is unstable (purple) and the other two (yellow) are stable: one with large \(Z\) and one with small \(Z\). Therefore if we start with \(l\) in this bistable range, we can move it up and then back down, and we will end up at the large-\(Z\) fixed point, and if we move \(l\) down and then back up, we will end up at the small-\(Z\) fixed point. This is an illustration of how bistability can arise in systems with positive feedback.
In terms of the lac operon, this would correspond to a situation with hysteresis in the levels of lacZ as a function of lactose levels. This is certainly plausible biologically, as it may be favorable to consume lactose until the levels are depleted beyond the level at which lactose metabolism turns on, particularly if switching metabolisms is costly.
Summary
We have seen how positive feedback can give rise to switch-like behavior and bistability, in the lac operon. It is possible to obtain similar types of behavior with negative feedback, which is also relevant in biological systems such as the lysogenic life cycle of \(\lambda\) phage, which we leave for another discussion.
References and further reading
Daniel Fisher’s cellular biophysics class
Mitchell Lewis, A Tale of two Repressors